What if you turned on the air conditioning (A.C.) to make it comfortable inside, but left all the doors and windows wide open? That doesn’t make a lot of sense, does it? Well, not keeping track of your digital stuff is a bit like that. You need to know who’s coming in and out!
Digital analytics is like having superspies on your website. They collect data about what people do when they visit your site. It’s like watching your friends play a game and keeping score. This data helps you make smarter decisions, like a game plan.
How does Google Analytics 4 work?
Google Analytics uses a special code that is placed on your website. Here’s what it looks like:
“This is the special code that is used by Google Analytics to track your website”
This code creates a “cookie” for each user and collects info about where they came from (like Google AdWords or Facebook), what device they’re using, and more.
The Audience page in Google Analytics gives you details about your website’s visitors. This includes things like their age, gender, location, language, and how they behave on your site.
It also tells you what kind of technology they’re using, like their web browser or operating system.
How to Add a Website to Google Analytics 4?
We’re going to focus on one basic topic – the installation of Google Analytics 4.
After logging into GA, in the Admin panel, click Create Property
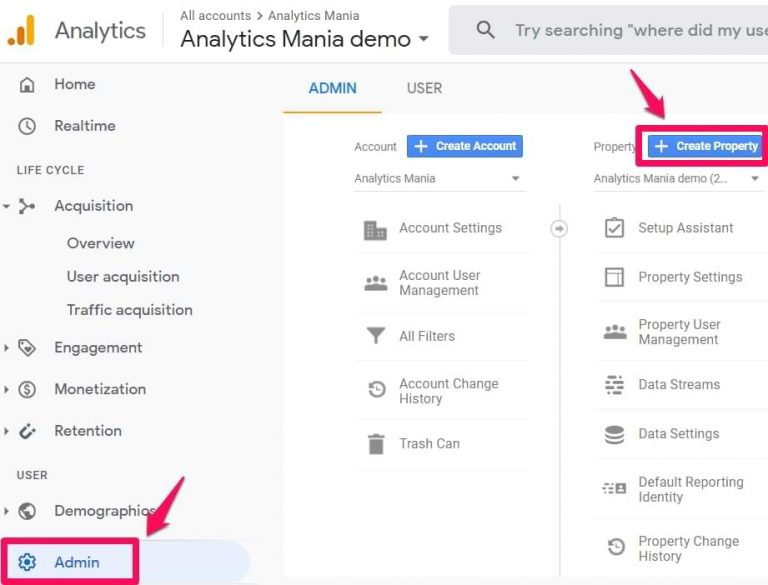
Enter the property name, such as your website address, your company, a brand, etc.

You will need to answer a few questions but that’s not necessary. Just click the ‘Create’ button.

Configure the data stream. If you want to link the analytics to your website, select Web. Additionally, you can opt for Android or iOS applications.
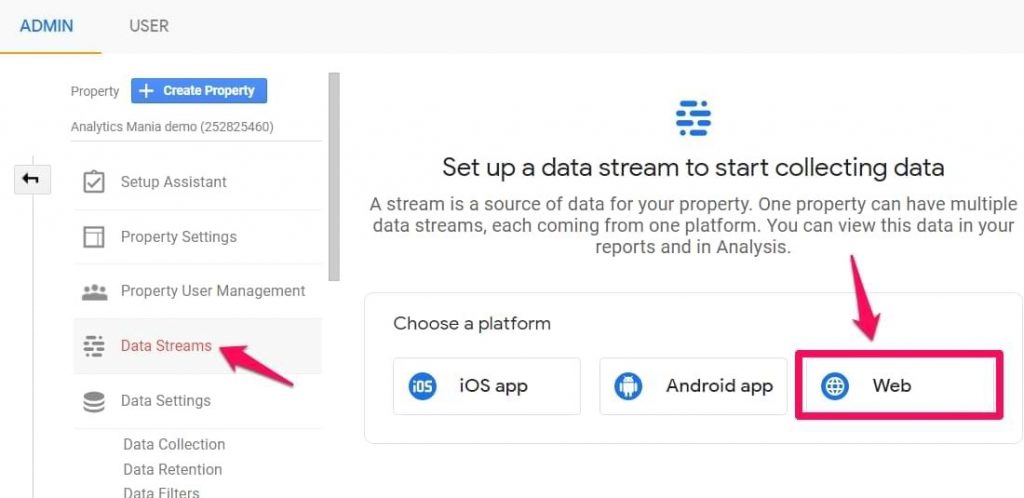
Enter the website URL and the stream name. You can choose any name you like. As you can see, Enhanced Measurement is enabled and it’s worth keeping it. This feature allows you to track multiple events without any extra setups.
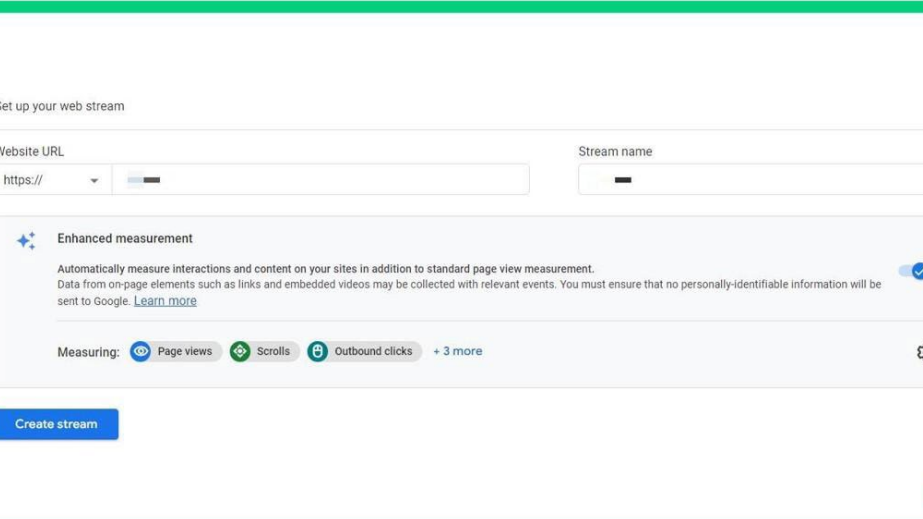
This feature will automatically track the following events.
- Page view
- Scroll
- Outbound link click
- Site search
- Video Engagement
- File Download
- Form submissions
Install Google Analytics 4 with Google Tag Manager
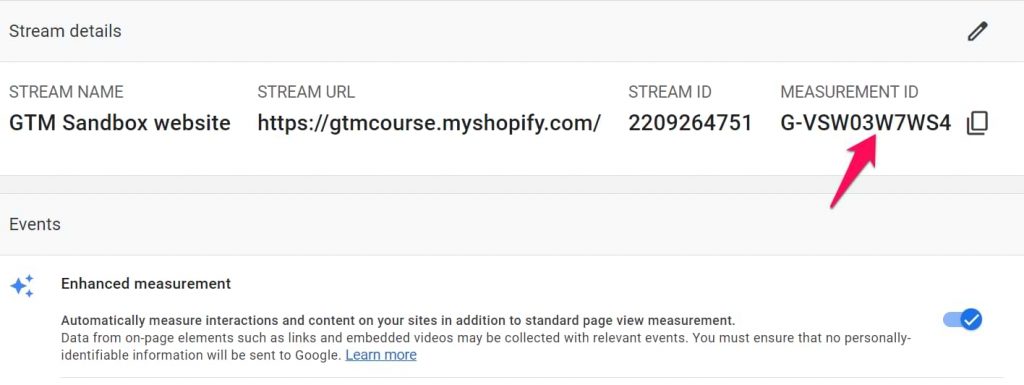
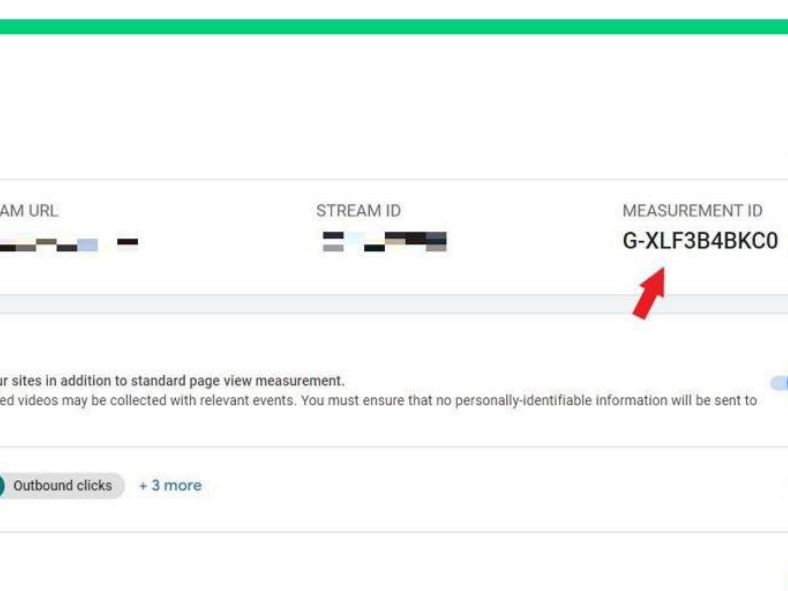
You will see a measurement ID when you create a data stream (web). Copy it, then go to your Google Tag Manager container and paste it into the Tag ID.

Google Analytics 4 setup guide for websites that use Universal Analytics
If you’re currently using Universal Analytics, the first step is to export your data from the old version of Google’s service.
Keep in mind After Google discontinues this service, accessing data from Universal Analytics will only be possible for six months.
Exporting will help you keep track of information and data comparisons during and after this transitional period.
- Log into Google Analytics Universal.
- Navigate to the report of interest using the following path:
- Click on “Acquisition.”
- Then, click on “Overview.”
- Next, click on “All Traffic.”
- Finally, select “Channels.”
- Choose the specific period for which you want to gather data.
- Click on the “Export” option.
- Select the format that best suits your needs. Options include:
- Google Sheets
- Excel
- CSV
By following these steps, you can easily access the desired report and export it in your preferred format for further analysis.
Getting Started with Google Analytics 4
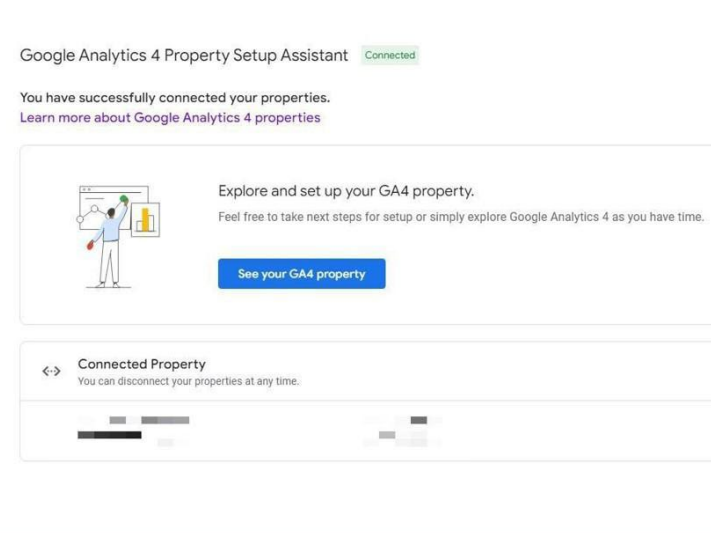
Log into Google Analytics, choose the Admin page (with the cogwheel icon), and click on Google Analytics Setup Assistant 4 to begin.
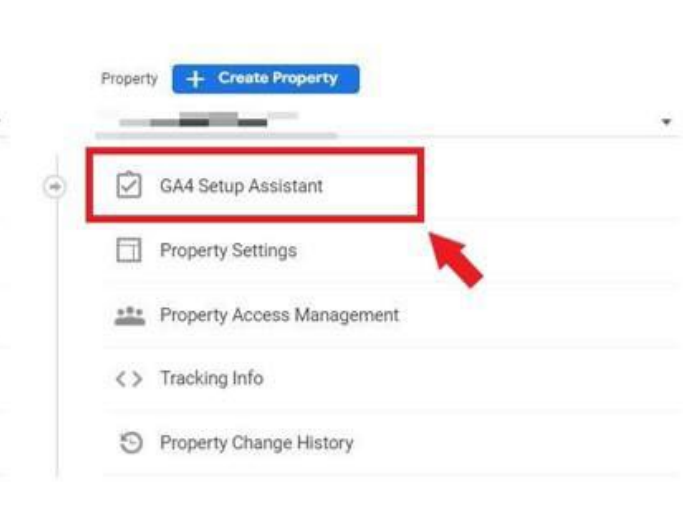
The system will guide you through configuration steps, and automatically connect your existing service to the new GA4.
This allows you to benefit from a data stream specifically created to track the web application.
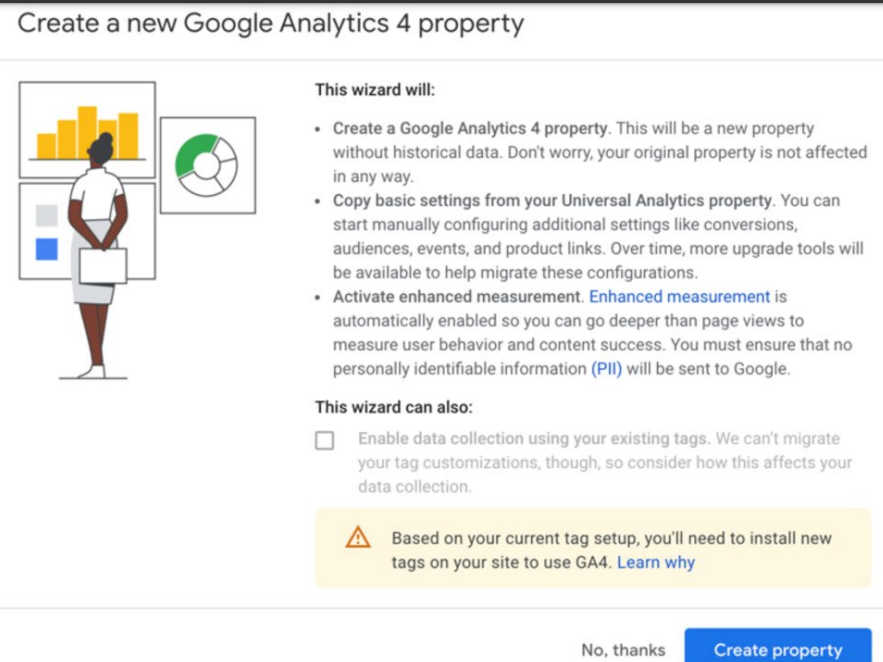
You will see a notification indicating that the services have connected successfully.
If you have used the analytics.js tag to implement Universal Google, you must now include the gtag.js code snippet for GA4. The code already contains an A service ID, which is applicable to GA3.
- Click View your Google Analytics 4 service
- Click the Tag installation
- Then select your data stream
- you’ll find the ID
Once the GA4 code is in place, data collection should be in progress.
Google Analytics 4 UI – how does it look?
Now it’s time to familiarize yourself with every section of the GA4 user interface.
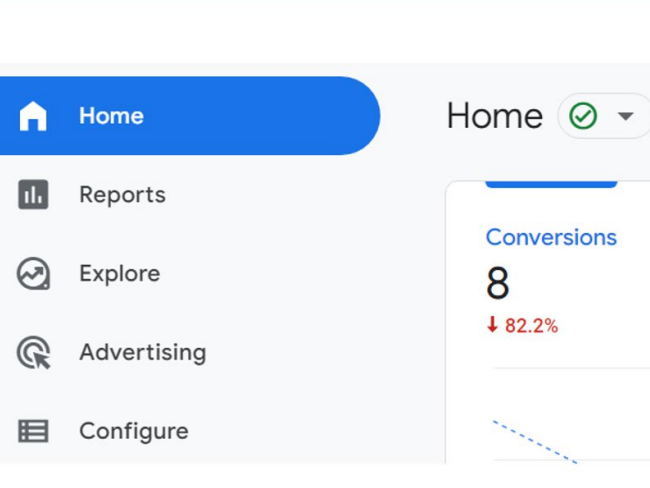
Navigation Menu GA4
After logging into GA4, a menu will appear on the left side of the screen. Initially, only the
icons are visible, but if you hover your mouse over the menu, dropdown items will appear.
Reports in GA4
When you choose “Reports” from the navigation menu, you can access a wealth of data.
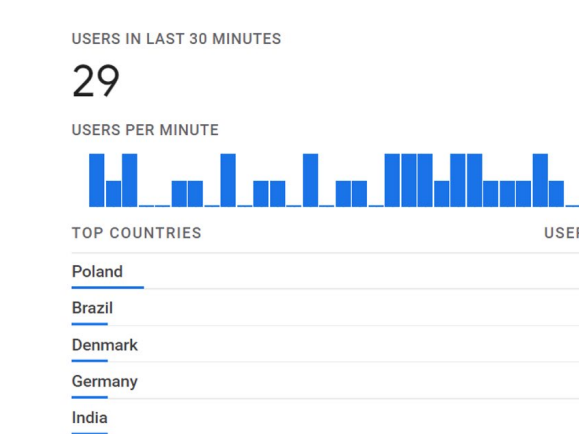
You’ll find information about the number of users who visited your page in the last 30 minutes, the number of visits per minute, and a list of the most popular countries where users are located.
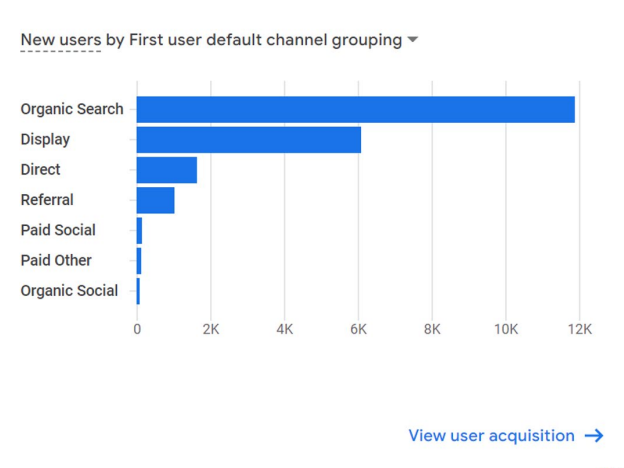
Here you can learn about traffic channels.
Additionally, the main window provides access to reports on users’ activity during a specified period or the most frequently visited pages.
In the menu, you will find some interesting options.
- The acquisition provides information on traffic sources.
- Engagement shows the most popular content
- Revenue generation data was collected by the advanced e-commerce module.
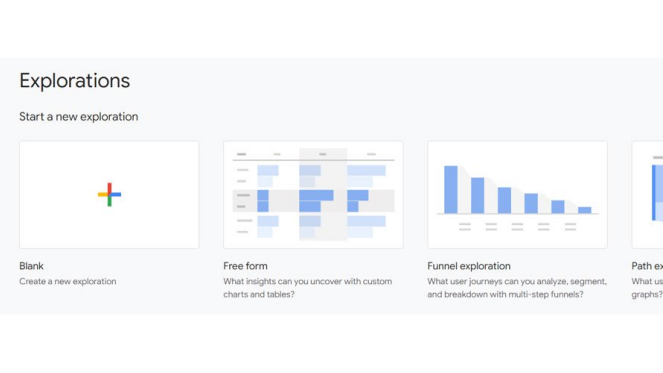
Exploration
Another option available from the main menu is “Exploration.”
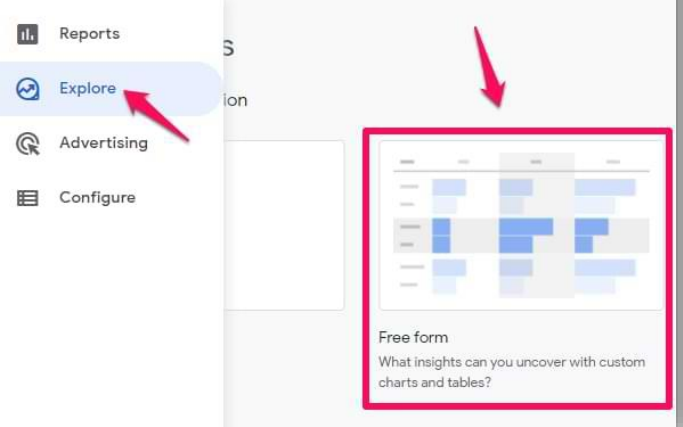
This is where you can analyze your data. Within the Explorations, you can access reports like Free Form, Funnel Exploration, Path Exploration, and more.
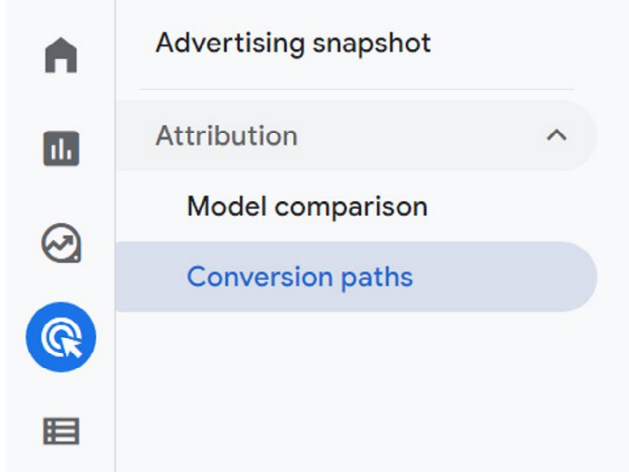
Advertising
The section title is vague.
It may seem like it provides data on your Google Ads campaigns, but it does not.
You have two choices:
Model Comparison or Conversion Path.